Tech/Domain:
Technology Stack
- MySQL
- Elasticsearch as a text search engine
- Logstash as a connector or data pipe from MySQL to Elasticsearch
- Kibana for monitoring and data visualization
- JDBC Connector
Problem Statement:
Searching data is an expensive affair and most important part of any application. With traditional architectures and single relational databases, fast-pace searching and analysis of data is very challenging.
Challenge:
E-commerce Websites started building their core business functionalities around MySQL with lesser products. Search functionality was achieved by using MySQL’s FULLTEXT.
As the company grew more and more products started entering into the database, and thus started the need to support more search with better options. But then searches started to become slower and slower, which irritated their customers and made it hard to convince new prospects to buy in.
Looking under the hood, the engineers realize that MySQL’s FULLTEXT indexes are not ideal for text look-ups on large datasets, and in order to scale up their operations, the engineers decide to move on to a more dedicated and battle-tested text search engine.
To work on the solution to this problem, we thought of implementing CQRS approach. What is CQRS???
Command query responsibility segregation (CQRS) is an application architecture pattern. This pattern is often used in event driven applications and is frequently associated with event sourcing. It consists of separating the logic that handles commands from the logic that handles queries.
In essence, the CQRS pattern is simply separating the command and query sides.
For this we would have to segregate the data writes to MySQL and use Elasticsearch for reading data, and thus achieve a blazing-fast full-text search.
But a new challenge then came in: How to get the data that is in a MySQL database into an Elasticsearch index, and how to keep the latter synchronized with the former?
The Solution:
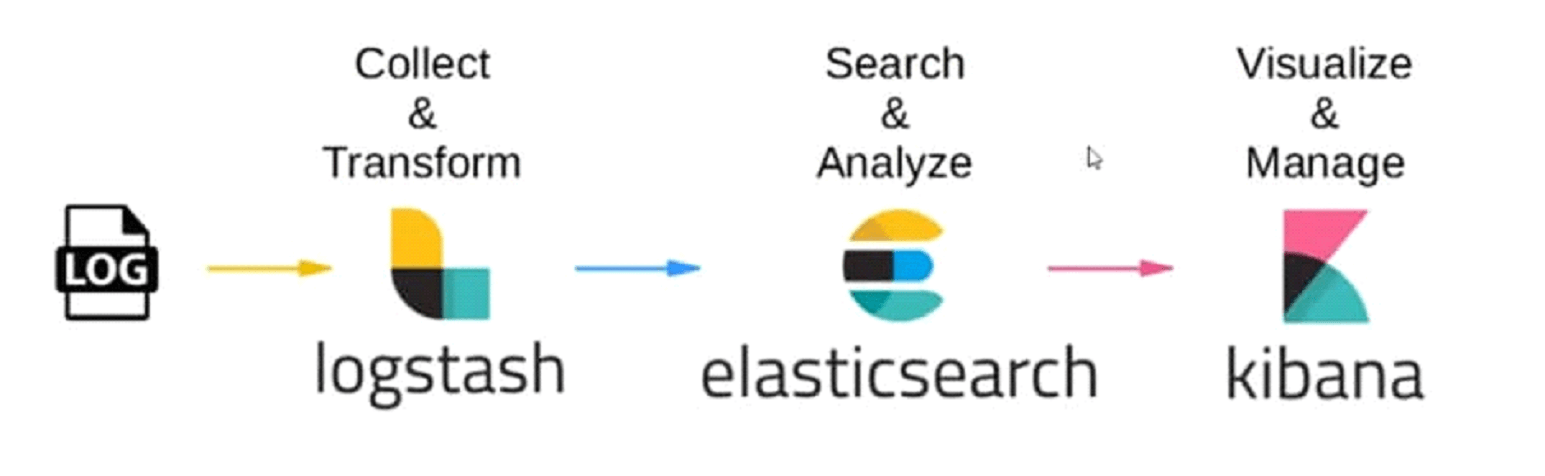
Using Logstash to periodically fetch data from MySQL, and mirror it on to Elasticsearch. This will take into consideration any changes on the MySQL data records, such as create, update, and delete, and have the same replicated on Elasticsearch documents.
Benefits of Solution: –
- We can use ingest data from different sources and outputs can also be configured as required to Logstash pipeline.
- We can parse, transform and filter data as per needs.
- Elasticsearch and Kibana together can help in smoother metrics and visualization of data.
We will create triggers on the table books that will populate a journal table books_journal with all changes on the books table (e.g. create , update , delete ). This means that whenever a record on the books table is created, updated, or deleted, this action will be recorded on the books_journal table, and the same action will be done on the corresponding Elasticsearch document. We will use the books_journal table to update of the Elasticsearch index.
Business Outcome
Prerequisites: –
Full source code can be found on GitHub
Steps: –
- 1. Setup a Docker file to setup MySQL, Elasticsearch and Kibana:
            version: '3'
            services:
              mysql:
                image: mysql:latest
                container_name: mysql
                ports:
                  - 3306:3306
                environment:
                  MYSQL_ROOT_PASSWORD: "root"
                  MYSQL_DATABASE: "elastic"
                  MYSQL_USER: "elastic"
                  MYSQL_PASSWORD: "elastic"
                volumes:
                  - ./data/:/docker-entrypoint-initdb.d/
              elasticsearch:
                image: docker.elastic.co/elasticsearch/elasticsearch:7.9.3
                container_name: elasticsearch
                ports:
                  - 9200:9200
                environment:
                  - discovery.type=single-node
                  - bootstrap.memory_lock=true
                  - "ES_JAVA_OPTS=-Xms512m -Xmx512m"
                  # ELASTIC_PASSWORD: '12345'
                volumes:
                  - ./volumes/elasticsearch:/usr/lib/elasticsearch/data
                logging:
                    driver: "json-file"
                    options:
                        max-size: "10k"
                        max-file: "10"
                kibana:
                image: docker.elastic.co/kibana/kibana:7.9.3
                container_name: kibana
                environment:
                  - "ELASTICSEARCH_URL=http://elasticsearch:9200"
                  - "SERVER_NAME=127.0.0.1"
                ports:
                  - 5601:5601
                depends_on:
                  - elasticsearch
- 2. Setup Logstash to pipe data from MySQL to Elasticsearch:
Let’s create a Dockerfile (named Dockerfile-logstash in the same directory) to pull a Logstash image, download the JDBC connector, and start a Logstash container. Add these lines to your Dockerfile:
            FROM docker.elastic.co/logstash/logstash:7.9.3# Download JDBC connector for Logstash
            RUN curl -L --output "mysql-connector-java-8.0.22.tar.gz" "https://dev.mysql.com/get/Downloads/Connector-J/mysql-connector-java-8.0.22.tar.gz"
&& tar -xf "mysql-connector-java-8.0.22.tar.gz" "mysql-connector-java-8.0.22/mysql-connector-java-8.0.22.jar"
&& mv "mysql-connector-java-8.0.22/mysql-connector-java-8.0.22.jar" "mysql-connector-java-8.0.22.jar"
&& rm -r "mysql-connector-java-8.0.22" "mysql-connector-java-8.0.22.tar.gz"ENTRYPOINT ["/usr/local/bin/docker-entrypoint"]
Before adding logstash pipeline we need some configurations to provide the input and output to this pipeline. In your project directory, create a volumes folder (if not already created) then create a directory to host our Logstash configuration: Then in this create a config directory, create a file pipelines.yml containing:
            - pipeline.id: from-scratch-pipeline
            path.config: "/usr/share/logstash/pipeline/ pipeline_config.conf"
Add a queries folder within it and add following query_books.sql
              SELECT    * FROM elastic.books_journal j
              LEFT JOIN elastic. books b ON b. books _id= j.product_id
              WHERE j.journal_id > :sql_last_value
                      AND j.action_time < NOW()
              ORDER BY j.journal_id
And a pipeline directory in which create a file pipeline_config.conf. with the following content:
            input {
              jdbc {
                jdbc_driver_library => "/usr/share/logstash/mysql-connector-java-8.0.22.jar"
                jdbc_driver_class => "com.mysql.jdbc.Driver"
                jdbc_connection_string => "jdbc:mysql://mysql:3306"
                jdbc_user => "elastic"
                jdbc_password => "elastic"
                statement_filepath => "/usr/share/logstash/config/queries/query_books.sql"
                use_column_value => true
                tracking_column => "journal_id"
                tracking_column_type => "numeric"
                schedule => "*/5 * * * * *"
              }
            }
            filter {
              if [action_type] == "create" or [action_type] == "update" {
                mutate { add_field => { "[@metadata][action]" => "index" } }
              } else if [action_type] == "delete" {
                mutate { add_field => { "[@metadata][action]" => "delete" } }
              }
            mutate {
                remove_field => ["@version", "@timestamp", "action_type"]
              }
            }
            output {
              elasticsearch {
                hosts => ["http://elasticsearch:9200"]
                index => "books"
                action => "%{[@metadata][action]}"
                document_id => "%{isbn}"
              }
            }
Once done add following do the docker-compose file to complete Logstash pipeline.
            logstash:
            build:
              context: .
              dockerfile: Dockerfile-logstash
            container_name: logstash
            # restart: on-failure
            depends_on:
              - mysql
              - elasticsearch
            volumes:
              - ./volumes/logstash/pipeline/:/usr/share/logstash/pipeline/
              - ./volumes/logstash/config/pipelines.yml:/usr/share//logstash/config/pipelines.yml
              - ./volumes/logstash/config/queries/:/usr/share/logstash/config/queries/
            logging:
              driver: "json-file"
              options:
                max-size: "10k"
                max-file: "10"
Understanding the pipeline.
The schedule parameter has a cron-like syntax (with a resolution down to the second when adding one more value the left), and uses the Rufus Scheduler behind the scene. Here we instruct Logstash to run this pipeline every 5 seconds with */5 * * * * * . During each periodic run, the parameter tracking_column instructs Logstash to store the journal_id value of the last record fetched and store it somewhere on the filesystem (See documentation here for last_run_metadata_path ). In the following run, Logstash will fetch records starting from journal_id + 1 , where journal_id is the value stored in the current run.
Testing We can add, update or delete to the books table and see the changes in ElasticSearch.